I saw a great talk at WordCamp San Diego this year given by Bill Erickson and Jared Atchison that gave some insight into how they track their productivity over time using data. They basically track time spent per project, then take the project’s budget and divide it by the number of hours spent to come up with an effective hourly rate. This number should increase over time as they become more efficient in what they do.
It prompted me to do a better job of tracking my hours on a per project basis, and then using that data to see what types of projects are most profitable over time. For example, is it better to take on bigger projects with larger budgets and longer timelines, or turn out smaller projects more frequently?
Taking it One Step Farther
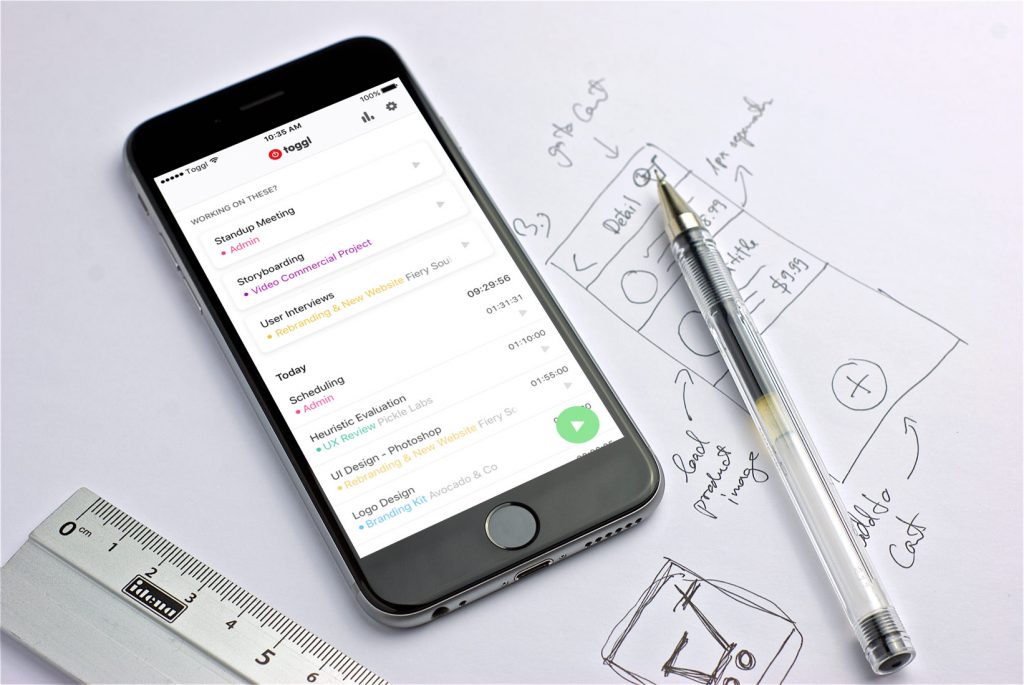
This has been a really useful productive tool, made even more helpful by tracking individual parts of each project. For that, I use the Toggl app and its combination of tags, tasks and project filtering to specify exactly what I am working on and then using that data to see how much time I’m spending on various development tasks.
On a full WordPress theme development project, it’s really helpful to know how much time is spent on front-end tasks (HTML/CSS/JS) vs actual theming (PHP). I can drill down deeper and breakdown time spent on WordPress tasks such as custom admin UI (metaboxes), custom post types, plugin customization (I’m looking at you, WooCommerce), etc.
Toggl has a tagging feature that is perfect for this use-case. I can setup tags for markup, theming, browser testing, etc, and then review statistics after the project is complete to see what percentage of my time was spent on each basic category of tasks. Combine that with a per project and per client filtering option, and you’ve got some great insights into your workflow, productivity. and profitably over time.
These breakdowns have been incredibly helpful when it comes to pricing out and scheduling projects. Since I have a much better idea of what it’s going to take to get each part of the puzzle completed, seeing the entire picture is a lot clearer when presented with a scope of work.
Improvements
Of course the overall goal is to become more efficient at what we do, which means improving our weaknesses as much as it means knowing our strengths. My goal is to review my project data once a quarter and see where my bottlenecks are, come up with a strategy to free up those restrictions and go from there.

